
What Is a Mining Royalty—and How Much Is Too Much?
Why Royalty Burden Can Make or Break a Project
The Hidden Weight on Every Deposit
In today’s exploration environment, most deposits are no longer “clean.”
They come layered with royalties—NSRs, GRRs, buybacks, sliding scales—that can quietly erode project value long before a mine is ever built.
At first glance, a 2–3% royalty may seem minor. In reality, stacked royalties can be the difference between a buildable project and one that never leaves the ground.
What Is a Mining Royalty?
A mining royalty is a financial interest retained by a third party that entitles them to a percentage of revenue or profit from future production.
Common Types of Royalties
NSR (Net Smelter Return)
The most common. A percentage of revenue after smelting/refining costs.
→ This is what most Nevada projects carry.GRR (Gross Revenue Royalty)
A percentage of total revenue before deductions.
→ More aggressive, less common in hard rock mining.Net Profits Interest (NPI)
Paid after operating costs.
→ Less impactful early, but still reduces upside.Sliding Scale Royalties
Increase with metal prices.
→ Dangerous in bull markets when margins should expand.
Why Royalties Exist
Royalties are often created when:
Property owners retain upside during a sale
Early investors take risk capital
Prospect generators vend projects
Companies defer upfront cash payments
They are, in essence, a way to finance risk with future production.
The Compounding Problem: Stacked Royalties
The real issue is not a single royalty—it’s stacking.
A project might carry:
2% NSR (original owner)
1.5% NSR (option agreement)
1% NSR (strategic investor)
Total: 4.5% NSR
At that level, you are no longer dealing with a minor encumbrance—you are fundamentally altering project economics.
Case Study: Nevada’s Fourmile Project
The Fourmile Project, controlled by Barrick Gold Corporation, is widely regarded as one of the most significant recent gold discoveries in Nevada’s Cortez District.
Geologically, it is a high-grade, structurally controlled gold system hosted in carbonate rocks in the footwall of the Roberts Mountains Thrust. Mineralization occurs in steeply dipping breccia bodies associated with the Sadler fault system and related anticline structures, with a footprint of roughly 2.4 km.
While broadly Carlin-type, Fourmile stands out due to:
Strong silicification
Minimal preg-robbing carbon
Multiple hydrothermal events (silicification, decalcification, argillization, sulfidation)
This results in:
Exceptionally high-grade intercepts, with reported averages in the ~15–16 g/t gold range
Favorable metallurgy relative to typical Carlin systems
Breakdown of the Royalty Stack
Despite its geological strength, Fourmile is encumbered by multiple legacy interests:
1. Teck Resources – Net Profits Interest (NPI)
~10% NPI
Increases to 15% after 6 million ounces produced
Carry-free
Implication:
Barrick funds development entirely while Teck participates in downstream profits—making this the most significant long-term economic burden.
2. Royal Gold – 1.6% GSR
Royal Gold holds a 1.6% Gross Smelter Return
Implication:
Direct reduction to top-line revenue regardless of operating costs.
3. Rio Tinto – ~1.2% Gross Production Royalty
Rio Tinto holds a ~1.2% sliding-scale royalty
Implication:
Royalty increases with gold price, limiting upside in strong markets.
Why This Structure Matters
These royalties operate at different levels of the economic stack:
GSR + gross royalty → reduce revenue immediately
NPI → captures downstream profitability
This creates a layered system where:
Revenue is reduced first
Costs are borne entirely by the operator
Remaining profits are shared
The Real Economic Effect
The issue is not just percentage—it’s interaction.
~2.8%+ removed from revenue (GSR + gross royalty)
Followed by 10–15% of profits
Resulting in:
Lower margins
Reduced NPV and IRR
Longer payback periods
Diminished acquisition appeal
How Much Royalty Is Too Much?.
Industry Benchmarks
1–3% NSR (or equivalent) → Normal / Financeable
Standard range across most viable projects. Typically does not materially hinder development.5–8% Total Royalty Burden → High / Constraining
Begins to noticeably compress margins and limit financing flexibility. Requires strong grades, good metallurgy, and favorable infrastructure.8–10%+ Total Royalty Burden → Often Unsustainable
At this level, projects struggle to generate sufficient returns. Development becomes highly sensitive to commodity prices and cost inflation.
Why These Thresholds Matter
Royalty burden scales directly with revenue—but its impact on value is nonlinear.
1. Margin Compression Accelerates
A move from 2% to 6% is not a 3x problem—it can:
Increase cutoff grades
Reduce recoverable ounces
Shorten mine life
2. Financing Becomes Increasingly Difficult
As total royalty burden rises:
Lenders discount cash flow more aggressively
Majors demand higher returns
Equity dilution increases
3. Sensitivity to Metal Prices Increases
Higher royalties:
Amplify downside risk in weak markets
Cap upside in strong markets (especially with sliding scales)
Important Distinction: Not All Royalties Are Equal
A key nuance—especially relevant to the Fourmile example:
3% NSR alone → manageable
3% GSR + 10% NPI → materially more severe
Royalties that stack across revenue and profit levels compound their impact.
Putting Fourmile in Context
Using these thresholds:
Revenue-level royalties: ~2.8%+
Profit-level royalty: 10–15% NPI
While it doesn’t fall cleanly into a single percentage band, the combined burden clearly pushes into the “high to extreme” category.
And yet, it works—because of:
~15–16 g/t grades
Favorable metallurgy
Tier-1 infrastructure
Which reinforces the broader conclusion:
If a project needs elite geology to withstand its royalty structure, the royalty is already too high for most deposits.
When High Royalties Can Work
High royalty burdens are not automatically disqualifying—but they impose strict requirements on a project.
In practice, only a small percentage of deposits can sustain 5–10%+ total royalty structures and remain economically viable.
1. Exceptional Grade
Grade is the most direct offset to royalty burden.
Higher grade → more revenue per tonne
Greater margin after royalties
Lower sensitivity to cost increases
At Fourmile, reported grades of ~15–16 g/t Au provide a margin profile capable of supporting both:
Revenue-level royalties
Profit-level participation (NPI)
Without strong grade, most high-royalty projects fail early in economic evaluation.
2. Favorable Metallurgy
Metallurgy determines recovery and processing cost.
Projects that can support higher royalties typically have:
High recovery rates
Simple processing flowsheets
Minimal penalty elements
Fourmile benefits from:
Minimal preg-robbing carbon
Strong silicification
Relatively straightforward processing compared to refractory systems
Complex metallurgy combined with high royalties is often prohibitive.
3. Strong Structural Continuity and Scale
A deposit must be both high-grade and laterally consistent.
Key requirements:
Continuous mineralization
Predictable geometry
Expansion potential
Fourmile’s:
~2.4 km mineralized footprint
Structurally controlled high-grade zones
…support the scale required to justify development despite royalty burden.
4. Existing Infrastructure and Processing Synergies
Infrastructure reduces capital intensity and improves project economics.
Projects that can support higher royalties often benefit from:
Nearby processing facilities
Established access and power
Reduced capital expenditures
Fourmile’s location within the Cortez complex provides:
Potential access to existing processing infrastructure
Lower incremental capex
Faster development timelines
Lower capital requirements help offset long-term revenue reductions from royalties.
5. Strong Commodity Price Environment
Higher metal prices can improve project economics:
Increased revenue enhances margins
However, royalties scale with price (especially GSR and sliding-scale structures)
High prices can enable development, but they do not resolve structural royalty burden.
6. Major Operator Advantage
Large operators can support projects that would not be viable for juniors.
Companies such as Barrick Gold Corporation benefit from:
Existing infrastructure
Lower operating costs at scale
Internal processing capacity
Strong balance sheets
A junior company with the same project would face:
Higher capital costs
Greater financing risk
Increased sensitivity to royalty burden
What is viable for a major operator is often not viable for a junior.
The Critical Reality
Even under optimal conditions, high royalties still:
Reduce project NPV
Extend payback periods
Limit operational flexibility
What Investors and Geologists Should Look For
In modern exploration, evaluating a deposit is no longer just about geology—it is about ownership. Royalty structures can materially alter project economics, even in otherwise strong systems. Investors and geologists must look beyond grade and scale to understand how much of a project’s value can realistically be retained.
When evaluating a project:
Key Questions
What is the total royalty burden (not just individual pieces)?
Are there buyback options? At what cost?
Do royalties stack across claims or ownership blocks?
Are there sliding scale triggers?
Red Flags
Total NSR above ~4%
No buyback provisions
Multiple legacy agreements
Poor documentation or unclear ownership
Quantifying the Impact: Royalty Burden vs Project Value
Understanding royalty structure qualitatively is essential—but its real significance becomes clear when measured quantitatively. Even small increases in royalty burden can translate into substantial reductions in project value over time.
The following model applies a range of royalty scenarios to a large-scale, long-life gold deposit to demonstrate how royalty burden impacts Net Present Value (NPV) under realistic operating conditions.
Theoretical Royalty Impact on Project Value (NPV Sensitivity)
Net Present Value (NPV) is the current value of all future cash flows from a project, adjusted for time and risk.
Assumptions (Theoretical Values)
Deposit size: 8 Moz gold
Mine Life: 30 years
Annual Production: ~267,000 oz/year
Gold Price: $4,500/oz
Recovery: 90%
AISC: $1,500/oz
Initial Capex: $1.6B
Discount Rate: 5%
NPV Calculation Methodology
The Net Present Value (NPV) used in this analysis is calculated using the standard discounted cash flow (DCF) model:
NPV = Σ [CFₜ / (1 + r)ᵗ] − C₀
Where:
CFₜ = Cash flow in year t
r = Discount rate (5% in this model)
t = Year of production (1–30)
C₀ = Initial capital expenditure ($1.6B)Annual cash flow is derived from:
Gold price
Production rate
Recovery
AISC
Royalty burden (applied to revenue and/or profit depending on structure)
NPV vs Total Royalty Burden (8 Moz, 30-Year LOM)
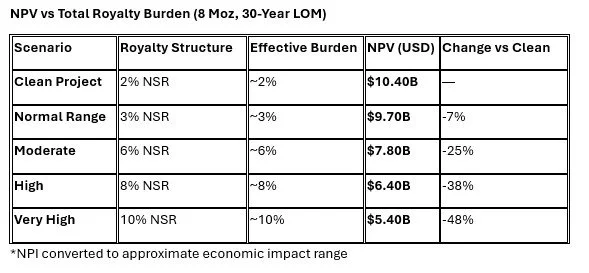
These are all theoretical calculations and do not reflect any real companies or projects and is a theoretical equation producing theoretical NPVs
Strategic Takeaway
Modern exploration is not just about finding ounces—it’s about owning them cleanly.
The best projects today are:
Geologically strong
Located in Tier-1 jurisdictions
Minimally encumbered by royalties
Because at the end of the day:
A great deposit with a heavy royalty can be worth less than a good deposit with a clean title.